 レンダラー]をクリックすると、
[レンダラー設定]ダイアログボックスが表示されます。
レンダラー]をクリックすると、
[レンダラー設定]ダイアログボックスが表示されます。Airflow Analyst > 操作ガイド Operation Guide > 可視化プロジェクト Visualization project
様々な格子データ可視化手法を「レンダラー」として設定し、3Dシーン上でレイヤーのように重ねて表示できます。
You can set various grid data visualization methods as "Renderer", and overlay them like layers on the 3D scene.
可視化ツールバーの[レンダラー]をクリックすると、
[レンダラー設定]ダイアログボックスが表示されます。
On the Visualization toolbar, click [Renderer]
to display the [Renderer Settings] dialog box.
 新規レンダラー]New Renderer]
可視化手法をこのメニューから選択すると、新規レンダラーが作成され、レンダラーリストに追加されます。
When you select a visualization method from this menu, a new renderer is created and added to the renderer list.
作成されたレンダラーの一覧です。 レンダラー名の左にあるチェックボックスで表示・非表示を切り替えます。
A list of created renderers. Switch the check box to show / hide each renderer.
レンダラー名をクリックすると、そのレンダラーの設定画面が表示されます。
Click the renderer name to display its setting tab.
レンダラーはリストの上から順に描画処理されます。
Renderers are rendered in order from the top of the list.
レンダラーリストで選択中のレンダラーを、リストの一つ上に移動させます。
Move the selected renderer up in the list.
レンダラーリストで選択中のレンダラーを、リストの一つ下に移動させます。
Move the selected renderer down in the list.
レンダラーリストで選択中のレンダラーを削除します。
Delete the selected renderer in the list.
レンダラーの設定変更を可視化プロジェクトに登録します。
Apply the changes of the renderer settings to the visualization project.
レンダラーの設定変更を可視化プロジェクトに登録して、この画面を閉じます。
Apply the changes of the renderer settings to the visualization project, and then close this dialog box
レンダラーの設定変更を取りやめて、この画面を閉じます。
Cancel changing the renderer settings, and close this dialog box.
レンダラーの描画計算に使用するデータソース(NetCDFファイル)の変数(variable)を指定します。
Set variables of the data source (netCDF file) used for rendering drawing calculation.
風速成分を示す変数をそれぞれ選択します。 [可視化プロジェクトのプロパティ]ダイアログボックスで設定された"風速成分フィールド"がデフォルトとなっています。
Select each variable indicating the wind components. The "Wind Components" set in the [Visualization Project Property] dialog box are the default.
Airflow Analystで作成したシミュレーションデータから平均風速を表示したい場合は、 平均風況のベクトル成分を格納した変数(tave_u、tave_v、tave_w)を選択してください。
By using the simulation data created by Airflow Analyst, to display the average wind speed as a vector, select the variables (tave_u, tave_v, tave_w) indicating the vector components of the average wind.
特定の変数を基にグラデーション表示やラベル表示したい場合、その変数を選択します。
To show color gradient or labels based on a specific variable, select that variable.
格子内の物体で遮られる箇所を指定する場合は、 格子マスク(0は空間、それ以外は物体)を示す変数(例: "mask")を選択します。
To specify parts obstructed by objects in the grid, select a variable (Example: "mask") indicating the grid mask ("0" for space, others for objects).
等値線や色の塗り分けで値を区分表示する際の分割数を設定します。
Set the number of divisions to display values separately with colored lines or colored separations.
可視化する値の範囲として、各フレームの最小値・最大値を自動的に適用する場合は、このチェックボックスをオンにします。
手動設定された最小値・最大値を適用する場合は、オフにします。
Select this check box to set the range of values automatically from the minimum and maximum values in each frame.
Clear this to apply manually entered values.
テキストボックスには、現在のフレームにおけるフィールド値の最小値・最大値が表示されます。 数値入力欄で、可視化する値の範囲を手動設定できます。
The text boxes display the minimum and maximum values of the field in the current frame. In the numeric input boxes, enter the range of values to be visualized.
最小値より小さな値の領域を描画したくない場合は、このチェックボックスをオンにします。
Select this check box if you want to hide the area of values less than Min value.
最大値より大きな値の領域を描画したくない場合は、このチェックボックスをオンにします。
Select this check box if you want to hide the area of values greater than Max value.
フィールド(値)の大小でグラデーション描画したい場合は、このチェックボックスをオンにします。
Select this check box to draw color gradient according to the Field (Value).
グラデーション描画に使用する色設定を選択します。
Select a color ramp for gradient drawing.
不透明に描画する場合は"0"を、半透明は"1"~"99"を、完全透過は"100"を入力します。
Enter "0" for opaque drawing, "1" - "99" for translucent, "100" for fully transparent.
透過描画すると、レンダラーの重なり順によっては図形が適切に3Dシーンに表示されないことがあります。 その際はレンダラーリストの[Up]と[Down]でレンダラーの順番を入れ替えてみてください。
When drawing translucently, depending on the order of renderers, objects on the 3D scene may not be shown properly. In that case, try changing the order of the renderers by [Up] and [Down] of the renderer list.
チェックボックスをオンにすると、点や線の境界をアンチエイリアス描画します。 ただしレンダラーの重なり順によっては適切に3Dシーンに描画されないことがあります。
Select this check box to perform anti-alias drawing of the boundary of points or lines. But depending on the order of renderers, objects on the 3D scene may not be drawn properly.
各種レンダラーの[ラベル]タブで、 フィールド値などをテキストとして描画するラベルを設定します。
On the [Label] tab of each renderer, set the label of the renderer to draw field values as text.
ラベルの表示・非表示を選択します。
Select this check box to draw labels.
ラベルの色を選択します。
Select label color.
フィールド(値)の大小でグラデーション描画したい場合は、このチェックボックスをオンにします。
Select this check box to draw color gradient by the Field (Value).
ラベルのサイズを選択します。
Select label size.
ラベルの基準点に対する水平位置を選択します。
Select the horizontal position relative to the reference point of a label.
ラベルの基準点に対する垂直位置を選択します。
Select the vertical position relative to the reference point of a label.
ラベルとレンダラー描画が重なる場合に、ラベルが手前に表示されるように奥行を調整します。
If labels and a renderer draw overlap, adjust the depth so that the labels are displayed in front.
ラベルとして描画する数値の小数点以下の桁数を入力します。
Enter the number of digits after the decimal point of the number to be drawn as a label.
オンにすると、数値を指数で表示します。
If it is selected, field values are displayed as exponent.
等値線レンダラー等の場合の設定です。
Settings for the Contour Line renderer, etc.
境界線の何本ごとにラベルを表示するか指定します。
Set how often the labels are displayed on the boundary line.
数値が小さいほど、境界線上のラベルが増えます。
The smaller the number, the more labels on the border line.
各種レンダラーの[格子領域]タブで、格子の可視化領域を設定します。 格子領域は複数設定することが可能です。
On the [Grid Region] tab of each renderer, set the display areas of the grid. Multiple areas can be set.
例えば、流入方向に直交する2D断面はI層であり、 その断面の位置や範囲を[範囲]欄で指定します。
For example, the 2D cross section orthogonal to the inflow direction is the I section, and the position or the extent is specified by [Extent] settings.
格子領域の設定の一覧です。行をクリックすると、下欄で設定を編集できます。 新規領域を追加したい場合は、*印の行をクリックしてください。
List of grid region settings. Click the row to edit the setting. If you want to add a new region, click the row with * mark.
それぞれの格子領域の表示・非表示を切り替えます。
Switch the visibility of each grid region.
格子領域の次元を選択します。
1Dは格子点を線状に表示し、2Dは面、3Dは立体です。
レンダラーによっては、選択できる次元が制限されます。
Select the dimension of the grid region.
1D: points in line, 2D: points in section, 3D: points in box
Depending on the renderer, the selectable dimensions are limited.
格子点を並べる方向を選択します。
Select the direction to align the grid points.
格子領域の範囲(広さ)を、格子点のインデックス値で設定します。 または、格子層の位置をスライダーバーで選択します。
Set the extent of the grid region by index value of the grid point. Otherwise set the position of the grid section with the slider bar.
格子点の間隔(粗密)を設定します。 数値が大きいほど間隔が開き、参照する格子点が少なくなります。 そのため、描画計算時間は短縮されますが、描画は荒くなります。
Set the spacing of the grid points. The larger the number is, the longer the interval is, and the number of grid points to be referenced is reduced. In this case, the calculation time to draw is shortened, but the drawing becomes rough.
各軸の範囲を始点から終点までに広げます。
Expand the range of each axis from the start point to the end point.
格子領域テーブルの*印の行を選択している場合、編集中の格子領域を新規領域として追加します。
When selecting the row with * mark in the table, add the editing grid regin as a new one.
編集中の格子領域を複製します。
Duplicate the editing grid region.
格子領域テーブルで選択された格子領域を削除します。
Delete the grid region selected in the table.
各種レンダラーの[斜交断面]タブで、 格子層と斜交する描画断面を設定します。 斜交断面の描画には、通常の格子層の描画よりも多くの処理時間・メモリが必要となります。
On the [Oblique Section] tab of each renderer, set the oblique sections to render.
このチェックボックスを選択すると、 [格子領域]で設定された領域ではなく、このタブで設定された斜交断面を表示します。
断面の相対位置を指定します。
断面のピッチ角を指定します。
断面のロール角を指定します。
各種レンダラーの[凡例]タブで、レンダラーの名称や凡例を設定します。 レンダラーの配色と値の対応を示す凡例を、3Dシーン上に描画できます。
On the [Legend] tab of each renderer, set the name and legend of the renderer. You can display a legend on the 3D scene that shows the correspondence between the color scheme of the renderer and the value.
レンダラーの名称を入力します。
Enter the name of the renderer.
このチェックボックスをオンにすると、3Dシーンにレンダラーの凡例が表示されます。
Select this check box to show the legend of the renderer on the 3D scene.
凡例に表示する数値の種別を選択します。
Select the type of the numeric value displayed in the legend.
| 項目 | 解説 |
|---|---|
| Item | Description |
| なし None | 数値を表示しません。 Values are not displayed. |
| 値 Value | 段階の最小値を表示します。(=開始値) Displays the minimum value of the class. (= Starting Value) |
| 開始値 Starting Value | 段階の最小値を表示します。 Displays the minimum value of the class. |
| 中間値 Middle Value | 段階の中間値を表示します。 Displays the middle value of the class. |
| 終了値 Ending Value | 段階の最大値を表示します。 Displays the maximum value of the class. |
凡例の幅を入力します。
Enter the width of the legend.
凡例に表示する数値の小数点以下の桁数を入力します。
Enter the number of decimal places of the numeric value displayed in the legend.
数値を指数で表記します。
 格子点レンダラー Grid Point Renderer
格子点レンダラーは、格子点を表示する描画機能です。
Grid Point Renderer draws points of the grid.
設定については『各種レンダラー共通の設定』を参照してください。
For settings, refer to "Common settings of renderers".
 格子線レンダラー Grid Line Renderer
格子線レンダラーは、格子線を表示する描画機能です。
Grid Line Renderer draws the mesh lines of the grid.

設定については『各種レンダラー共通の設定』を参照してください。
For settings, refer to "Common settings of renderers".
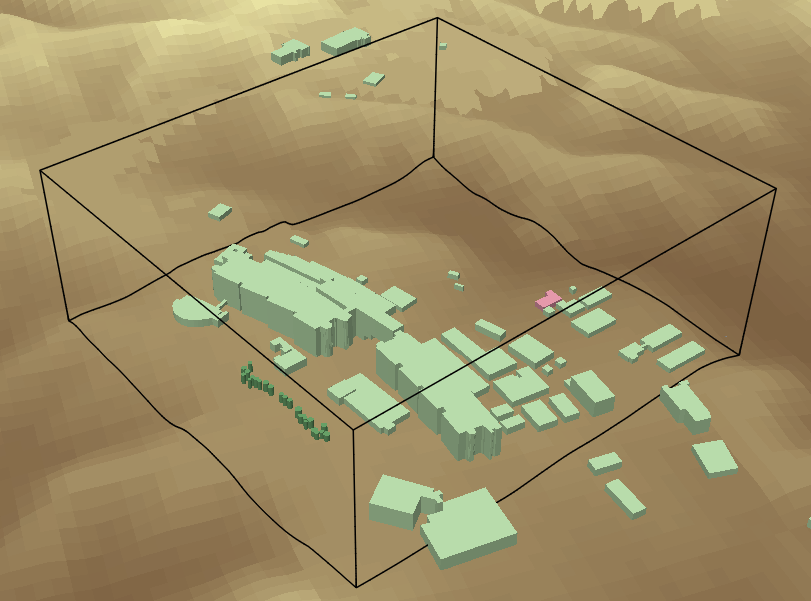
 格子枠レンダラー Grid Box Renderer
格子枠レンダラーは、格子の外枠を表示する描画機能です。
Grid Box Renderer draws the outer frame lines of the grid.
設定については『各種レンダラー共通の設定』を参照してください。
For settings, refer to "Common settings of renderers".
 格子マスク・レンダラー Grid Mask Renderer
格子マスク・レンダラーは、格子における地表面や物体の形状を表現する描画機能です。 フィールド(マスク)の値を参照して、対象となる格子点群を囲むように描画されます。
Grid Mask Renderer draws how the geometries of the buildings and other objects are captured on the grid. Referencing to the value of [Field (Mask)], it is drawn around the target grid points.
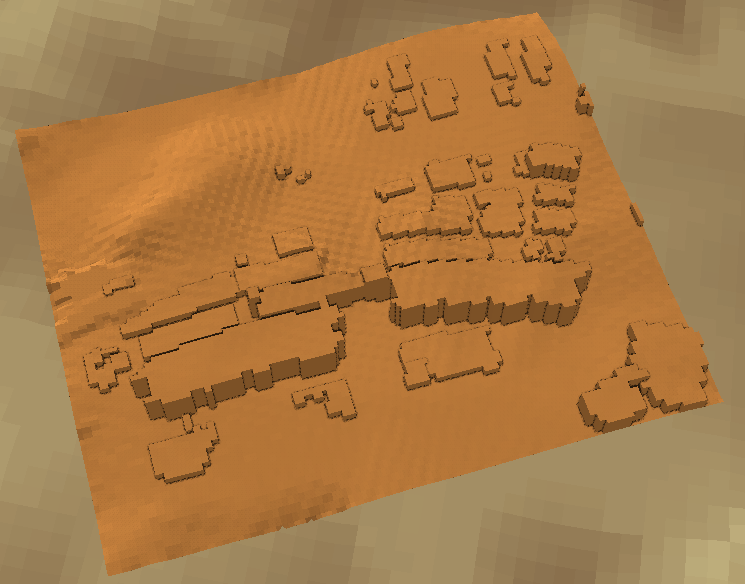
計算格子中の物体として設定された領域など、この変数の値が"0"以外である領域が、 立体的な面として描画されます。
Grid areas whose value in this variable are other than "0", such as areas judged as object in the computational grid, will be drawn as three-dimensional surfaces.
オンにすると、数値入力欄に設定したフィールド(マスク)値の範囲の領域を囲むように描画します。
オフの場合は、フィールド(マスク)値が0以外の領域を描画します。
Select this check box to draw around the areas in the range of the Field (Mask) values set in the numeric input box.
Clear this to draw areas with Field (Mask) values other than 0.
[フィールド(値)]が設定されている場合、マスクを構成する各セルの表面にどのようにフィールド値を与えるかを選択します。
| 項目 | 解説 |
|---|---|
| Items | Description |
| 補間 | 各セルの頂点位置において補間されたフィールド値を採用します。 ラベル表示などの際は、各セル面の4つの頂点における値の平均値が表示されます。 |
| Interpolated | Apply interpolated field values at the vertex position of each cell. When displaying labels, averaged values at the four vertices of each cell face are displayed. |
| 内部 | 各セルの面において、内部にある格子点のフィールド値を採用します。 |
| Inner | Apply a field value of the internal grid point for each cell face. |
| 外側 | 各セルの面において、外側に接する格子点のフィールド値を採用します。 |
| Outer | Apply a field value of the outer neighboring grid point for each cell face. |
| 中間 | 各セルの面において、"内部"と"外側"の平均値を採用します。 |
| Middle | Apply an averaged value of "Inner" and "Outer" for each cell face. |
オンにすると、フィールド(値)の最小値未満の領域が指定色で描画されます。
If it is selected, areas below the minimum value of the Field (Value) are drawn with the selected color.
オンにすると、フィールド(値)の最大値を超える領域が指定色で描画されます。
If it is selected, areas over the maximum value of the Field (Value) are drawn with the selected color.
オンにすると、格子マスクの表面に格子線を描画します。
If it is selected, grid lines are drawn on the grid mask.
マスク表面の奥行・段差を明瞭にしたい場合は、このチェックボックスをオンにしてください。 段差の部分にGPUで計算された陰影が描画されます。
Select this check box if you want to emphasize the depth / step of the mask surface. The shadow calculated by the GPU is drawn at the corner.
このチェックボックスをオンにすると、陰影の点描をぼかして滑らかにします。
Select this check box to blur the shade and make it smoother.
陰影の計算・描画範囲を指定します。
Set the shadow calculation / drawing range.
陰影の濃さを指定します。 数値が大きいほど濃く(暗く)なります。
Set the shade depth. The larger the number, the thicker (darker) it becomes.
ラベルを表示するI、J、Kの間隔を指定します。
Enter the interval of I, J, K for displaying labels.
格子マスクの外側にラベルを描画するため、表面からの距離を指定します。
To draw labels outside the grid mask, set the distance from the surface.
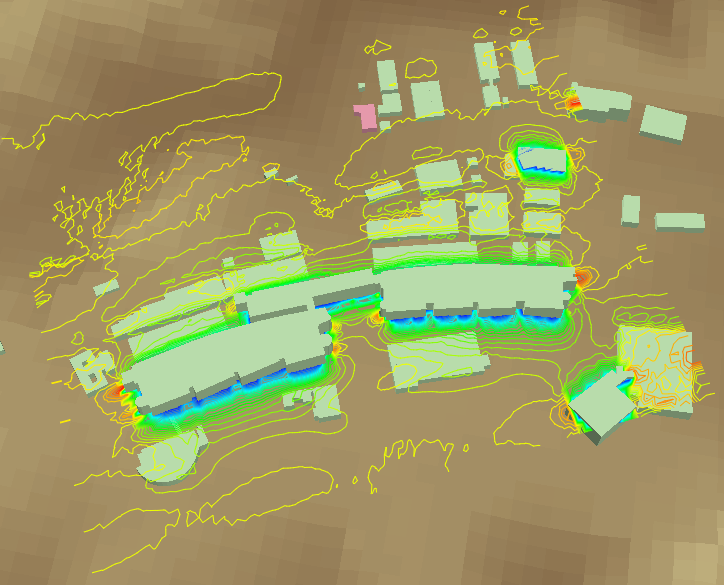
 等値線レンダラー Contour Line Renderer
等値線レンダラーは、風速や拡散物質の濃度などの分布を、指定した断面で等値線として表現する描画機能です。
Contour Line Renderer draws contour lines on a specified section expressing the distributions of the wind speed, concentration of diffusion materials, and other variables.
値の範囲の分割数を指定します。 等値線の色数は、[分割数] + 1となります。
Set the number of divisions of the range of values. The number of colors is [Division] + 1.
[最小・最大 自動判定]がオンの場合、 等値線の値の間隔は、自動的に検出される値の範囲によってフレーム毎に変化します。 また、最大値と最小値の等値線は出現しません。
If [Automatic Min / Max Calculation] is selected, the interval of values of contour lines will vary on every frame by automatically detected range of values. Also, the contour lines of the maximum and the minimum value will not appear.
[最小・最大 自動判定]をオフにして、 [最小値]="0.0"、[最大値]="10.0"、[分割数]="10"を設定すれば、等値線の間隔は"1.0"に固定されます。
If [Automatic Min / Max Calculation] is cleared, setting [Min] = "0.0", [Max] = "10.0", [Divisions] = "10" will fix the interval of the contour lines to "1.0".
等値線の上に数値を描画します。 見やすいように数値ラベルの表示間隔や表示密度等を調整してください。
Edit the settings to draw numeric values on the contour lines. Adjust the display interval of the label, display density, etc. to make it easy to see.
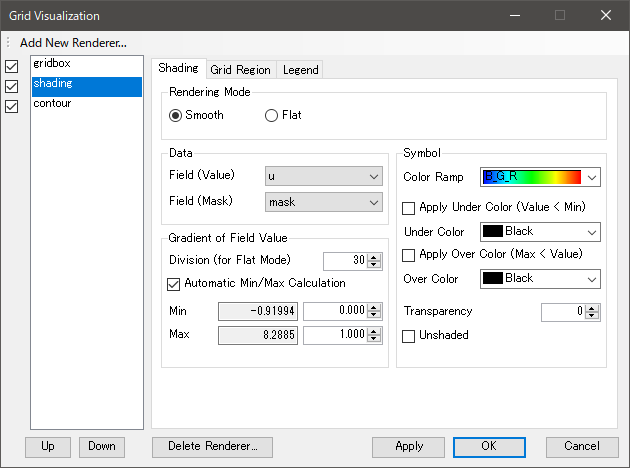
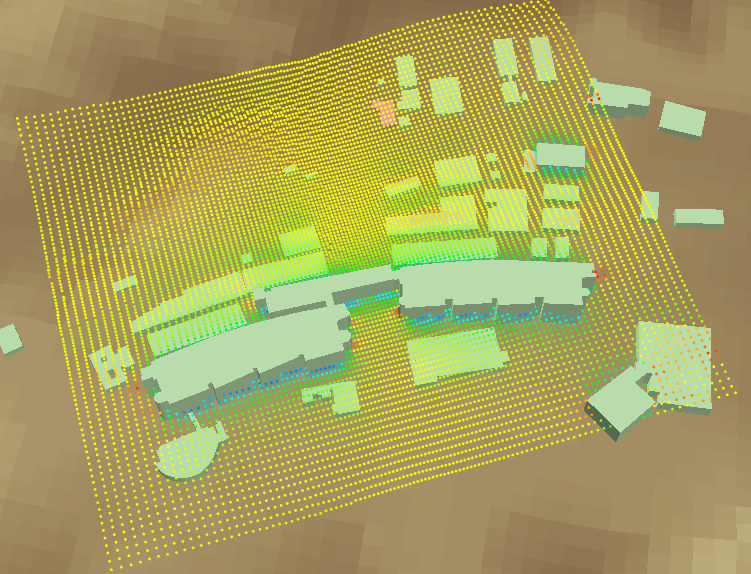
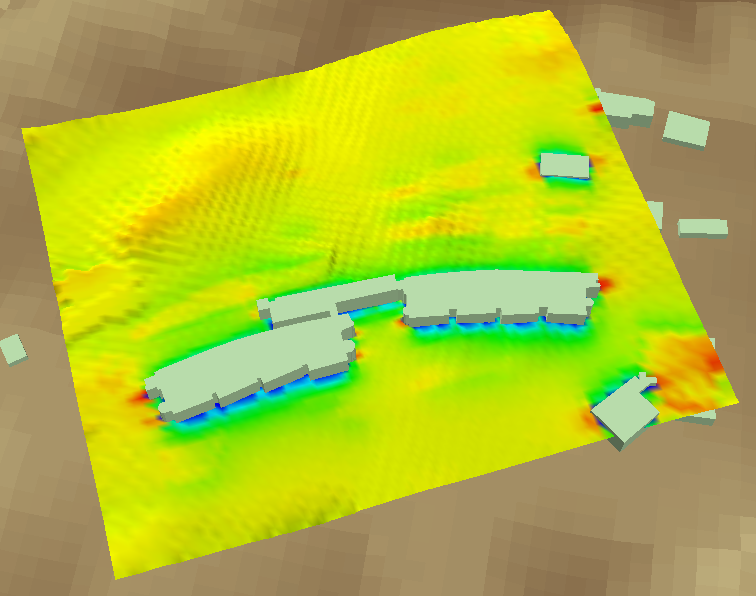
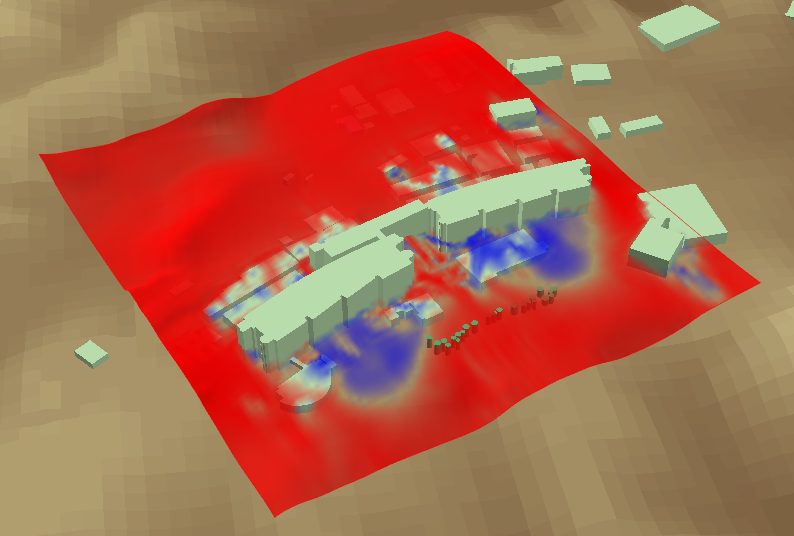
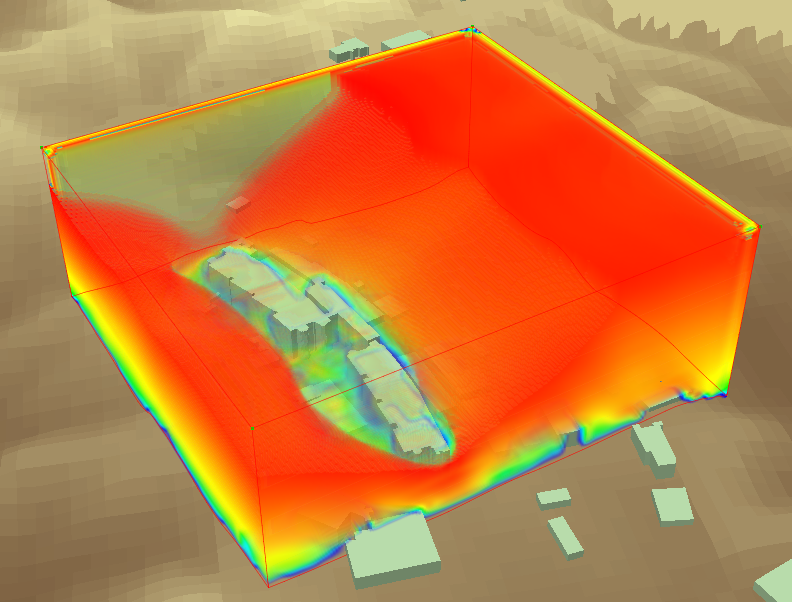
 シェーディング・レンダラー Shading Renderer
シェーディング・レンダラーは、風速や拡散物質の濃度などの分布を格子の断面でグラデーション表示する描画機能です。
Shading Renderer draws color gradation on a specified grid section expressing the distributions of the wind speed, concentration of diffusion materials, and other variables.
このオプションを選択すると、滑らかなグラデーションで描画します。
Select this option to fill the grid section with the smooth gradient.
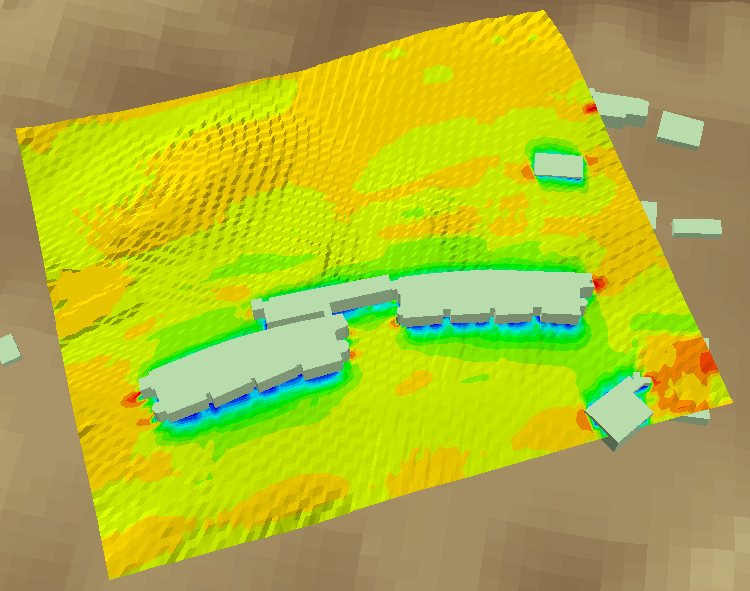
このオプションを選択すると、[分割数]で分割された区分ごとに、均一な色で塗り分けます。 値の判別がしやすくなります。
Select this option to fill each part divided by [Division] with uniform color. This makes it easier to distinguish the value.
オンにすると、フィールド(値)の最小値未満の領域が指定色で描画されます。
If it is selected, areas below the minimum value of the Field (Value) are drawn with the selected color.
オンにすると、フィールド(値)の最大値を超える領域が指定色で描画されます。
If it is selected, areas over the maximum value of the Field (Value) are drawn with the selected color.
このチェックボックスをオンすると、面に陰影をつけずに描画します。
Select this check box to draw faces without shade.
描画モードが"フラット"の場合、塗り分け領域の境界線を描画できます。
When the rendering mode is "Flat", the boundary of the painted area can be displayed.
オンにすると、境界線を描画します。
Select this check box to display border lines.
描画モードが"フラット"で、境界線の表示がオンの場合のみ、境界線上にラベルを表示できます。
Labels can be displayed on border lines only when the rendering mode is "Flat" and the border line display is on.
 等値面レンダラー Contour Surface renderer
等値面レンダラーは、特定の値の分布を3Dの表層面として表現する描画機能です。
例えば、拡散シミュレーションの結果から指定濃度の面を等値面表示すると、
その濃度の分布する範囲が立体的に確認できて便利です。
Contour Surface Renderer draws the distribution of a specified value as 3D surfaces.
For example, if the surface of the specified concentration is displayed in the isosurface from the diffusion simulation result,
it is convenient to see the distribution range of the concentration on the 3D scene.

等値面を形成するための変数を選択します。
Select a variable to form an isosurface.
等値面をグラデーション描画したい場合に、変数を選択してください。
[フィールド(等値面)]と同じ変数が選択された場合は、グラデーション表示されません。
Select a variable to draw contour surfaces with color gradient.
If the same variable as [Field (Surface)] is selected here, it will not be displayed as the color gradient.
等値面を描画する値を入力します。
Enter the value to draw as contour surface.
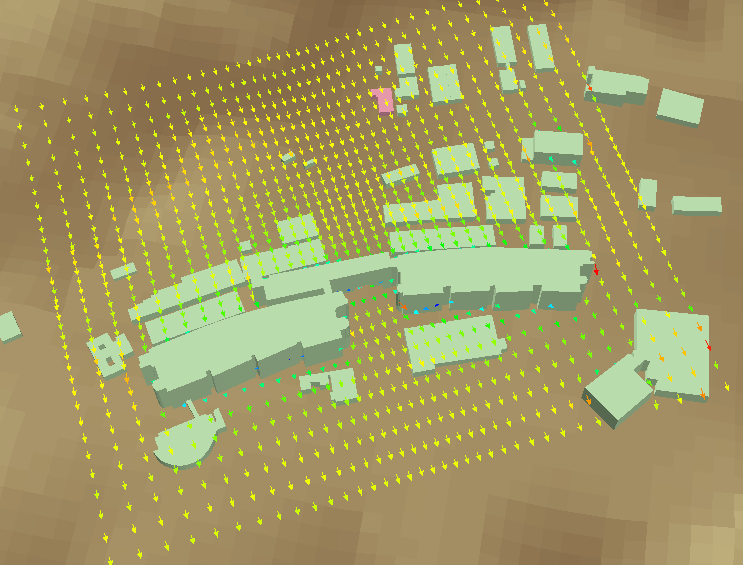
 ベクトル・レンダラー Vector Renderer
ベクトル・レンダラーは、格子接点上の風向や風速を矢印(ベクトル)として表現する描画機能です。
Vector Renderer draws the wind direction and the wind speed on the grid point as arrows (vectors).
このチェックボックスをオンにすると、[フィールド(値)]の値でグラデーション描画します。 フィールドが空欄の場合は、ベクトルの大きさ(風速)を用います。
Select this check box to draw vectors with the color gradient by values from [Field (Value)]. If [Field (Value)] is blank, the magnitudes of vectors (wind speed) are used.
矢印の長さや矢先を各パラメーターで調整して、見やすくします。
Adjust the arrow length and arrowhead with each parameter to make it easier to see.
矢印の軸の長さを入力します。
Enter the length of the arrow shaft.
矢先の大きさを入力します。
Enter the size of the arrowhead.
矢先の鋭さを角度で指定します。
Enter the angle to set the sharpness of the arrowhead.
軸を中心とした矢先の回転角を角度で指定します。
Enter the angle to set the rotation of the arrowhead around its shaft.
オンにすると、流速値が大きいほど矢先が大きくなります。
If it is selected, the larger the flow spped value is, the larger the arrow head becomes.
オンにすると、流速値が大きいほど矢印が長くなります。
If it is selected, the larger the flow spped value is, the longer the arrow head becomes.
オンにすると、俯角が浅い場合でも矢印が見やすいように、矢先の回転角を自動調整します。
If it is selected, automatically adjust the roll angle of arrows so that the arrows will be easy to see even when the depression angle is shallow.
矢先の形状を選択します。
Select a shape of the arrowhead.
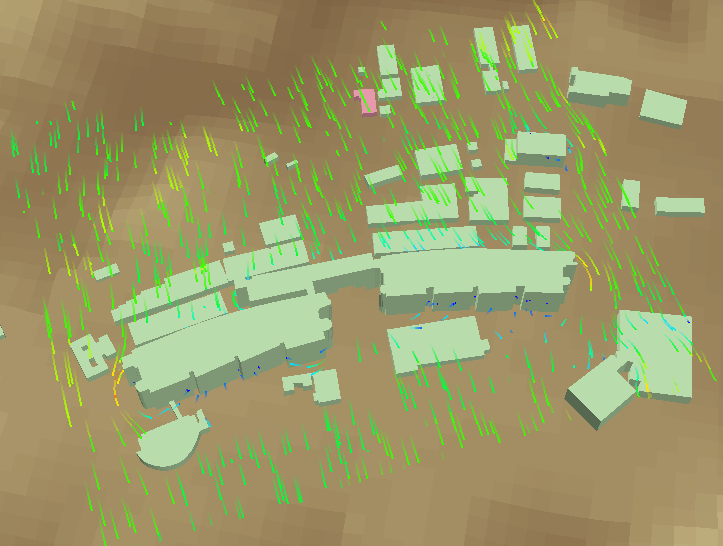
 粒子追跡レンダラー Particle Trace Renderer
粒子追跡レンダラーは、指定した格子点から質量の無い仮想粒子を放出した場合の粒子の軌跡をシミュレートする描画機能です。 粒子を放出する位置やタイミング、最大数を指定することで、描画される粒子の密度を調整します。
Particle Trace Renderer displays the trajectories of virtual particles that are released from arbitrary points in the computational grid. Adjust the density of the particles by specifying the position, timing and maximum number of particles to release.
このレンダラーは、アニメーション再生を開始したフレームから連続的に描画計算を行います。 [フレーム指定]ボックスなどでフレームが飛ばされると、描画計算はリセットされます。
This renderer performs drawing calculation continuously from the frame that the animation started. When a frame is skipped by editing the [Edit Frame Number] box or the like, the drawing calculation is reset.

粒子を放出する時間的間隔を指定します。
Set the interval of frames to release particles.
粒子放出回数を制限します。
Set the max number of release times.
描画する粒子の数を制限します。
Set the max number of particles to draw.
このチェックボックスをオンにすると、粒子を放出位置毎に別の色で塗り分けます。
Select this check box to divide the particles by different colors for each release position.
このチェックボックスをオンにすると、粒子を放出タイミング毎に別の色で塗り分けます。
Select this check box to divide the particles by different colors for each release time.
放出される粒子を球体で描画します。
Settings to draw particles as spheroids.
同じ地点から放出された粒子をつなぐ線を描画します。
Settings to draw lines connecting particles released from the same point.
同じタイミングで放出された粒子をつなぐ線を描画します。
Settings to draw lines connecting particles released at the same time.
それぞれの粒子の軌跡を線で描画します。
Settings to draw the path of each particle with a line.
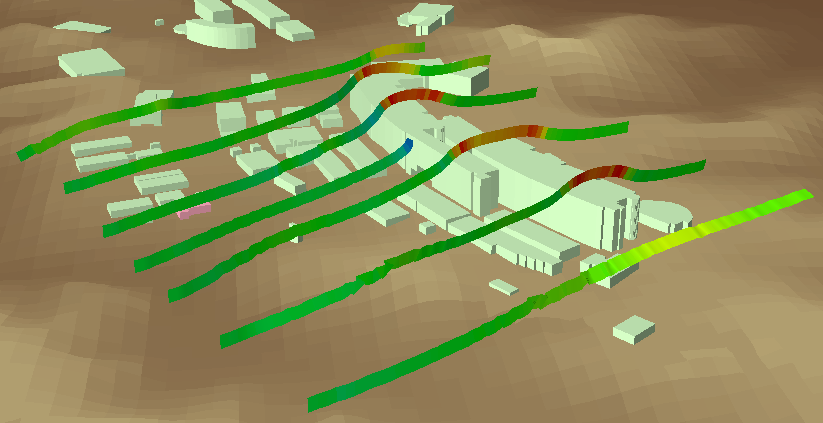
 流線レンダラー Streamline Renderer
流線レンダラーは、特定の格子点から吹き流された線を表現する描画機能です。
Streamline Renderer draws lines that are blown from specific grid points.

流れを線で表現します。
Draw the streams as lines.
リボンのような形状の描画となり、流れの旋回をねじれで表現できます。
Draw the streams like as ribbons, expressing the turning of the flow by twisting.
この値を増やすと、より長い流線が描画されます。
Increasing this value will draw longer streamlines.
この値を減らすと、より緻密な流線が描画されます。
Reducing this value will draw more complicated streamlines.
指定位置から風下方向の流線が描画されます。
Streamlines in downwind direction are drawn.
指定位置から風上方向の流線が描画されます。
Streamlines in upwind direction are drawn.
指定位置から風上・風下の両方向の流線が描画されます。
Streamlines in both downwind and upwind directions are drawn.
線描画モードの場合に、流線上に矢印を描画します。
In the line drawing mode, draw arrows on the streamline.
矢印を流線の節点に描画します。
Draw arrows at the node of the streamline.
[節点上に表示]がオフの場合、格子領域に対する矢印の出現頻度の指定となり、 数値が大きいほど矢印が増加します。
When [On Nodes] is cleared, this parameter specifies the appearance frequency of the arrows to the grid region, and the larger the number, the more arrows will be displayed.
[節点上に表示]がオンの場合は、矢印を描画する節点の間隔の指定となり、 数値が小さいほど矢印が増加します。
When [On Nodes] is selected, this parameter specifies the spacing of the nodes to draw the arrows, and the smaller the number, the more arrows will be displayed.
リボンの幅を指定します。
Set the width of the ribbon.
リボンの回転角を指定します。
Set the angle of the ribbon.
リボンの捩れやすさを指定します。
Set the twistability of the ribbon.
このチェックボックスをオンにすると、[フィールド(値)]の値でグラデーション描画します。 フィールドが空欄の場合は、風ベクトルの大きさ(風速)を用います。
Select this check box to draw lines with the color gradient by values from [Field (Value)]. If the field is blank, the magnitudes of vectors (wind speed) are used.
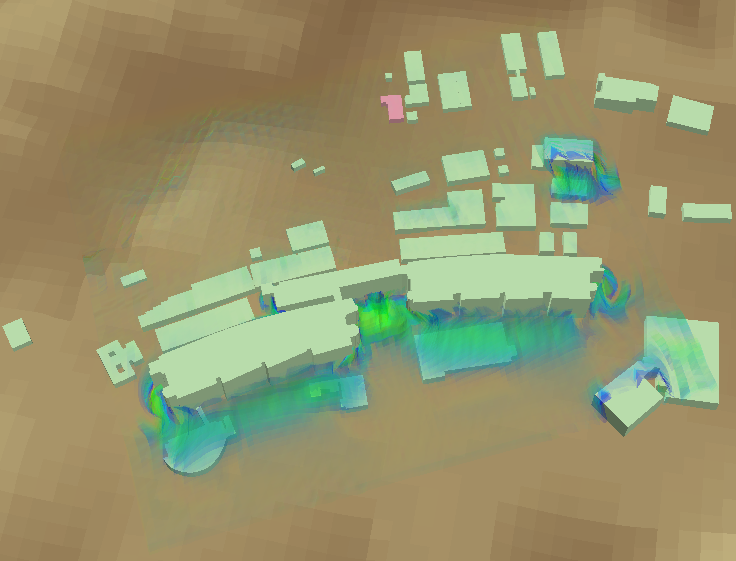
サーフィスパス・レンダラーは、粒子の軌跡を面で表現する描画機能です。 粒子挙動の立体的な構造を視覚化します。 粒子追跡レンダラーと同様な設定で、煙のような表現が可能になります。
Surface Path Renderer draws the trajectory of particles by faces. It visualizes the 3D structure of particles' behavior. With the same settings as the Particle Trace Renderer, it can produce effects like smoke.
このチェックボックスをオンにすると、放出タイミング毎に面を塗り分けます。
Select this check box to paint the faces separately for each release time.
サーフィスの透過度を指定します。
Set the transparency of the surface.
[基準透過度]が適用されるサーフィス値(0.0~1.0)の範囲を指定します。
Set the range of the surface value (0.0 ... 1.0) to which [Default Transparency] is applied.
[基準透過度 適用範囲]の範囲外のサーフィス値領域への、フェード効果の強弱を指定します。 値が大きいほどフェード効果が広範囲に及びます。
Set the strength of the fade effect to the surface value areas beyond [Range for Default Transparency]. The larger the value, the wider the fade effect will be.
定常流レンダラーは、時間次元が無い(フレーム間アニメーションができない)データを用いて仮想の粒子を動かし、軌跡を表示する描画機能です。 平均風速場の風況などを直感的に把握できます。
Steady State Flow Renderer draws the trajectory of virtual particles moved by data without time dimension. You can intuitively grasp the wind condition of the average wind speed field etc.
格子のK層に沿って風速成分U・Vのみを使用して描画するため、鉛直方向の動きは考慮しません。
Using only the wind component U and V along the K section of the grid, so the vertical motion will not be considered.
可視化ツールバーの[アニメーション再生]ボタンをクリックすると、流れの描画が進展します。
時系列データに即して描画しているのではなく、風速の平均場に沿って描画しています。
すなわち、描画に使用する平均風速場は常に同一なので、
同じ地点を通過する粒子は常に同じ動きをします。
Click the [Start] button on the Visualization toolbar to progress the flow movement.
Instead of drawing according to the time series data, it is drawn according to the wind speed of the average field.
That is, since the wind speed of the average field used for drawing is always the same,
particles passing through the same point always move in the same way.
気象GPVデータなどの、特定の時刻の風の動きを可視化するのに適しています。
It is suitable for visualizing wind movement at a specific time. (Weather GPV Data, etc.)
オンの場合は、現在のフレームのデータのみでアニメーション表示します。
フレームが変わると、アニメーションは途切れます。
可視化ツールバーの[ 再生(単フレーム)]ボタンが有効になります。
オフの場合は、フレームが推移してもアニメーションは途切れず連続的に表示されます。
If it is selected, animate only with the data of the current frame.
When the frame changes, the animation will be cut off.
On the Visualization toolbar, [Start (Single Frame)] button will be enabled.
If it is cleared, when the frame changes, the animation will be continuously displayed without interruption.
オンの場合は、フィールドU、Vから計算した流速を適用します。
オフの場合は、可視化に適した流速を格子の範囲から自動計算します。
Select this check box to use the flow speed calculated from the Field U and V.
Clear this to adjust the flow speed by the grid range to be suitable for visualization.
流速に掛ける係数を入力します。
Enter the factor that multiply the flow speed by.
この値が大きいほど、全体の粒子の数が増加します。 粒子はランダムな位置に生成され、一定の存続期間で消滅し、また新たに生成されます。
The larger this value, the more the total number of particles will increase. Particles are generated in random positions, disappear in a certain duration, and are newly generated.
この値が大きいほど、粒子の存続期間が延び、軌跡が長くなります。
The larger this value, the longer the particle's lifetime, and the longer its trajectory.
この値が大きいほど、可視化される軌跡が長くなります。
The larger this value, the longer the visible trajectory.
二極シェーディング・レンダラーは、最小値と最大値の両極を強調表示するシェーディング・レンダラーです。 中心値を透明にして、最小値や最大値に向かって二色でグラデーション描画します。
Two Sides Shading Renderer draws highlighting both minimum and maximum value poles. It makes the center value transparent, and draws gradation in two colors toward the minimum value and the maximum value.
最小値の領域の描画色です。
The drawing color of the min value area.
最大値の領域の描画色です。
The drawing color of the max value area.
値が小さいほど、不透過度の変化が中心値付近ではゆるやかに、両極値付近では急激になります。
The smaller this value, the gentler the change of the opacity around the center value, and the sharper around the side value.
オンの場合は、[中心値]に入力された値を中心値とします。
オフの場合は、最小値・最大値の平均を中心値とします。
Select this check box to adopt the value of [Centering Value].
Clear this to take the average of min and max as the centering value.
任意の値を中心値とします。
Enter the arbitrary value as the centering value.
指定された格子領域における元データの最小値・最大値です。
Min and max value of the original data in the current grid region.
[最小・最大 自動判定]がオフの場合には、ここに入力された最小値・最大値が適用されます。
Enter the custom min and max value applied if [Automatic Min/Max Calculation] is cleared.
現在の設定において描画に適用される最小値・最大値です。
Min and max value applied to drawing in the current setting.
ボリューム・レンダラーは、3次元的な広がりのあるデータを表示する描画機能です。
表示状態では描画のためのデータ処理に時間がかかるので、デフォルトで非表示になっています。
[シンボル]欄以外の設定を変更する際は、非表示状態にしておくとデータ処理を省略できます。
Volume Renderer draws data with three-dimensional spread.
It takes time for data processing for drawing in the display state, so it is hidden by default.
When changing settings other than the [Symbol], data processing can be skipped if it is set to non-display state.
オンの場合は、0を中心値とします。
オフの場合は、最小値・最大値の平均を中心値とします。
Select this check box to take 0 as the centering value.
Clear this to take the average of min and max as the centering value.
ボリュームを構成するメッシュの解像度を入力します。 数値が大きいほどボリュームは細かくなりますが、処理に時間がかかります。
Enter the resolution of mesh that make up the volume. The larger the number, the more detailed the volume will be, but processing takes time.
ボリュームが滑らかになるように、指定された数だけメッシュを補間します。 "1"の場合は補間しません。
Interpolate the mesh by the specified number so that the volume becomes smooth. If the number is "1", interpolation is not performed.
ボリューム層の色の明るさを指定します。
Set the brightness of the color of volume layers.
ボリューム層の不透明度を指定します。
Set the opacity of volume layers.
ボリューム層の補間処理の回数を指定します。
Set the number of interpolation processing of the volume layer.
格子領域全体の範囲を0.0~1.0として、どの範囲を描画するか指定します。 たとえば0.1~0.9の場合、両端が少し切り取られて描画されます。
With the range of the entire grid region from 0.0 to 1.0, specify the range to draw. For example, in the case of 0.1 to 0.9, both ends are cut out when rendered.
オンにすると、最小値・最大値の二極シェーディングで描画します。
Select this check box to draw with two sides shading between min and max.