レンダリングデータの出力
Export rendering data
各種レンダラーで作成されたレンダリングデータを、様々な形式のファイルに出力できます。
Export rendering data created by renderers to various format files.
シェープファイル出力
Exporting shapefile
各レンダラーの描画結果をGISソフトで閲覧できるように、
形状データや属性データをシェープファイルに出力します。
レンダラーによって、マルチパッチ・フィーチャーや、Z値付きのポリラインシェープなどの形式で出力されます。
Export shapes drawn by each renderer to a shapefile
so that rendering result can be displayed with GIS software.
Depending on the renderers, they are exported in the form of multipatch, polylines with Z value, and so on.
- 対応レンダラー
- 格子枠、格子線、格子点、ベクトル、等値線、粒子追跡、格子マスク、等値面、シェーディング
- GridBox, GridLine, GridPoint, VectorFlow, ContourLine, ParticleTrace, Shading, ContourSurface, GridMask
- 可視化ツールバーの[エクスポート > シェープファイル出力]をクリックします。
- On the Visualization toolbar, click [Export > Shapefile].
- シェープファイル出力ダイアログボックスで、出力オプションを指定します
- In the Export Shapefile dialog box, edit the export options.
- [レンダラー]
- [Renderer]
出力するレンダラーを選択します。
Select a renderer to export.
- フレーム
- Frame
- [現在のフレーム]
- [Current Frame]
現在のフレームのみ出力します。
Export only the current frame.
- [フレーム範囲]
- [Frame Range]
指定された範囲のフレームを一つのシェープファイルにまとめて出力します。
Export selected frames together in one shape file.
- [出力]をクリックします。
ファイル保存ダイアログボックスでシェープファイルの出力先を指定し、[保存]をクリックします。
- Click [Export].
In the save file dialog box, select the destination of the shapefile, and then click [Save].
KMLファイル出力
Exporting KML
各レンダラーの描画結果をGoogle Earth等で閲覧できるように、
形状データをKMLファイルに出力します。
格子点や等値線など点や線の形状データはKMLに直接記述され、
シェーディングや等値面など面の形状データはCOLLADA(.dae)ファイルに別途出力されます。
Export shapes drawn by each renderer to KML file
so that rendering result can be displayed with Google Earth etc.
Point and line shape data such as grid points and contour lines are directly written in KML,
and surface shape data such as shading and isosurfaces are output separately to the COLLADA (.dae) file.
- 対応レンダラー
- KMLのみ: 格子枠、格子線、格子点、ベクトル、等値線、粒子追跡
- KML only: GridBox, GridLine, GridPoint, VectorFlow, ContourLine, ParticleTrace
- COLLADA: 格子マスク、等値面、シェーディング、二極シェーディング
- COLLADA: GridMask, ContourSurface, Shading, TwoSidesShading
- 可視化ツールバーの[エクスポート > KMLファイル出力]をクリックします。
- On the Visualization toolbar, click [Export > KML].
- KML出力ダイアログボックスで、出力オプションを指定します。
- In the Export KML dialog box, edit the export options.
- [レンダラー]
- [Renderer]
出力するレンダラーを選択します。
Select a renderer to export.
- フレーム
- Frame
- [現在のフレーム]
- [Current Frame]
現在のフレームのみ出力します。
Export only the current frame.
- [フレーム範囲]
- [Frame Range]
指定された範囲のフレームを出力します。
(※形状データがCOLLADA(.dae)ファイルに別途出力されるレンダラーのみ対応)
Export selected frames.
(* For renderers which shape data is separately exported to the COLLADA (.dae) file.)
- KML時間設定
- KML Time Settings
- [アニメーション用に時間情報を付加する]
- [Set Time Info for Frame Animation]
Google Earthで日時に基づく表示やアニメーションをしたい場合は、チェックボックスをオンにします。
Select this check box to display and animate based on date and time with Google Earth.
- [元データの時間情報を適用する]
- [Apply Original Time Data]
データソース(NetCDF)の日時をそのまま出力したい場合は、チェックボックスをオンにします。
オフの場合は、Google Earthで常に最新の時間軸として表示されるように、2900年1月1日から1フレーム1秒とした日時が設定されます。
Select this check box if you want to output the date and time of the data source (NetCDF) as it is.
If it is cleared, to display as the latest time axis in Google Earth, the date and time is set as one frame per second from January 1, 2900.
- ベクトルレンダラーの設定
- Vector Flow Settings
Vector Flowレンダラー用の設定です。
Settings for Vector Flow renderers.
- [流速によってシンボルのサイズを変える]
- [Vary Symbol Size by Flow Speed]
オンにすると、流速によって矢印シンボルのサイズが変化します。
Select this check box to vary the size of the arrow symbol by flow speed.
- [流速の範囲]
- [Flow Speed Range]
矢印シンボルのサイズが最小・最大になる流速をそれぞれ設定します。
Set the flow speed at which the size of the arrow symbol becomes minimum and maximum.
- [出力]をクリックします。
ファイル保存ダイアログボックスでファイル形式と出力先を指定し、[保存]をクリックします。
- Click [Export].
In the save file dialog box, select the file format and export destination, and then click [Save].
ファイル形式は、.kml(一つの.kmlと複数の.dae)と、.kmz(一つのファイルにまとめた形式)から選択できます。
.daeファイルが生成される場合は、KMLファイルと同じ名称のフォルダが作成され、その中に出力されます。
The file format can be selected from ".kml" (one .kml and multiple .dae) and ".kmz" (archived).
If ".dae" files are generated, a folder with the same name as the KML file is created, and output in it.
VTKファイル出力
Exporting VTK
計算結果データを他の可視化ソフトでレンダリングできるように、
データソース(NetCDF)の格子点座標と変数データをVTKファイルに出力します。
Export coordinates of the grid points and variable data from netCDF data source to VTK file
so that computation result can be visualized with other visualization software.
- 可視化ツールバーの[エクスポート > VTKファイル出力]をクリックします。
- On the Visualization toolbar, click [Export > VTK].
- VTK出力ダイアログボックスで、出力オプションを指定します
- In the Export VTK dialog box, edit the export options.
- [出力するフィールド]
- [Fields to Export]
出力する変数を選択します。
Select variables to export.
- フォーマット
- Format
- ファイル形式
- File Format
- [XML]
- [XML]
VTK XMLフォーマット(.vts)で出力します。
Export as VTK XML format (.vts).
- [レガシー]
- [Legacy]
VTKレガシーフォーマット(.vtk)で出力します。
Export as VTK legacy format (.vtk).
- データ種別
- Data Type
- フレーム
- Frame
- [現在のフレーム]
- [Current Frame]
現在のフレームのみ出力します。
Export only the current frame.
- [フレーム範囲]
- [Frame Range]
指定された範囲のフレームを、フレーム毎のVTKファイルに出力します。
Export selected frames to VTK files for each frame.
- オプション
- Options
- [風ベクトルを出力する]
- [Export Wind Vector]
可視化プロジェクトのプロパティダイアログボックスで風速成分フィールドに設定した変数を
風ベクトルとして出力したい場合は、チェックボックスをオンにします。
Select this check box to output the wind vector
by the wind speed component fields set in the Visualization Project Property dialog box.
- [出力]をクリックします。
ファイル保存ダイアログボックスでVTKファイルの出力先を指定し、[保存]をクリックします。
- Click [Export].
In the save file dialog box, select the destination of the VTK file, and then click [Save].
複数フレームのXMLフォーマットファイル(.vts)を出力する場合は、
.vtsファイル群がフォルダにまとめられ、それらを統合するためのVTKコレクションファイル(.pvd)が作成されます。
When outputting multi-frame XML format files (.vts),
.vts files are grouped in a folder, and a VTK collection file (.pvd) is created to integrate them.
STLファイル出力
Exporting STL
各レンダラーの描画結果を他の3DCGソフトで閲覧できるように、
形状データをSTLファイルに出力します。
Export shapes drawn by each renderer to STL file
so that rendering result can be displayed with other 3DCD software.
- 対応レンダラー
- 格子マスク、シェーディング、粒子追跡 (流跡線)
- GridMask, Shading, ParticleTrace (ParticlePath)
- 可視化ツールバーの[エクスポート > STLファイル出力]をクリックします。
- On the Visualization toolbar, click [Export > STL].
- STL出力ダイアログボックスで、出力オプションを指定します。
- In the Export STL dialog box, edit the export options.
- [レンダラー]
- [Renderer]
出力するレンダラーを選択します。
Select a renderer to export.
- フォーマット
- Format
- データ形式
- Data Format
- [バイナリ]
- [Binary]
バイナリ形式で出力します。
Export the data in binary format.
- [アスキー]
- [Ascii]
文字列形式で出力します。
Export the data in ascii format.
- 小数表記
- Ascii Float Field
- [指数]
- [Exponent]
数値を指数で表記します。
Express numerical values in exponential notation.
- [小数点]
- [Fixed Point]
数値を小数点で表記します。
Express numerical values in decimal.
- 3Dモデル
- 3D Model
- [底部の厚さ]
- [Base Thickness]
GridMaskレンダラーを3Dモデルとして出力する際に、
底部に付加する厚みをマップの単位(m)で指定します。
When exporting a GridMask renderer as a 3D model,
specify the thickness to be added to the bottom in units of map (m).
- 3Dライン (パイプ)
- 3D Line (Pipe)
パーティクルパスなどの線形は3Dパイプとして出力されます。
Linear shapes such as particle paths are output as 3D pipes.
- [丸み]
- [Roundness]
パイプ断面の辺の数を指定します。数値が大きいほど円形になります。
Set the number of sides of pipe cross section. The larger the number, the more circular it becomes.
- [半径]
- [Radius]
パイプの半径を指定します。単位はマップの単位(m)です。
Set the radius of the pipe in units of map (m).
- [出力]をクリックします。
ファイル保存ダイアログボックスでSTLファイルの出力先を指定し、[保存]をクリックします。
- Click [Export].
In the save file dialog box, select the destination of the STL file, and then click [Save].
動画ファイル出力
Exporting movie file
可視化アニメーションをAVI形式の動画ファイルに出力します。
出力される動画の画面サイズは、3Dシーンの画面サイズと同じです。
Export visualization animation to AVI format movie file.
The screen size of the output movie is the same as the screen size of the 3D scene.
- 可視化ツールバーの[エクスポート > アニメーション動画出力]をクリックします。
- On the Visualization toolbar, click [Export > Export Animation].
- 動画設定ダイアログボックスで、出力オプションを指定します。
- In the Movie Settings dialog box, edit the export options.
- [フレームレート]
- [Frame Rate]
動画で1秒間に表示するフレーム数を指定します。
Set the number of frames to display per second in a movie.
- [フレーム範囲]
- [Frame Range]
動画に出力するフレームの範囲を指定します。
Select the range of frame to export.
- [出力]をクリックします。
ファイル保存ダイアログボックスで、動画ファイルの保存先を指定して、[保存]をクリックします。
- Click [Export].
In the save file dialog box, select the destination of the movie file, and then click [Save].
- ビデオの圧縮ダイアログボックスで、
ビデオコーデックを設定し、[OK]をクリックします。
- In the Video Compression dialog box,
set a video codec, and then click [OK].
- 可視化アニメーションが再生され、動画ファイルが作成されます。
- The visualization animation plays and a movie file is created.
格子点フィーチャーレイヤーの作成
Creating grid point feature layer
Airflow Analystの風況シミュレーションデータ(NetCDF形式)は、
ArcGISの[マルチディメンションツール]を使って、ポイント・フィーチャーレイヤーとして表示することができます。
Wind simulation data created by Airflow Analyst (netCDF format)
can be displayed as a point feature layer by using [Multidimension Tools] of ArcGIS.
以下の手順で、シミュレーションデータから、水平断面または垂直断面の格子点フィーチャーレイヤーを作成します。
Follow the steps below to create a grid point feature layer in the horizontal or vertical section from the simulation data.
- ArcToolboxの[マルチディメンションツール > NetCDFフィーチャーレイヤーの作成]をダブルクリックします。
- In the ArcToolbox window, Double-click [Multidimension tools > Make NetCDF Feature Layer].
- NetCDFフィーチャーレイヤーの作成ダイアログボックスで、以下のように設定します。
- In the Make NetCDF Feature Layer dialog box, edit the settings as follows:
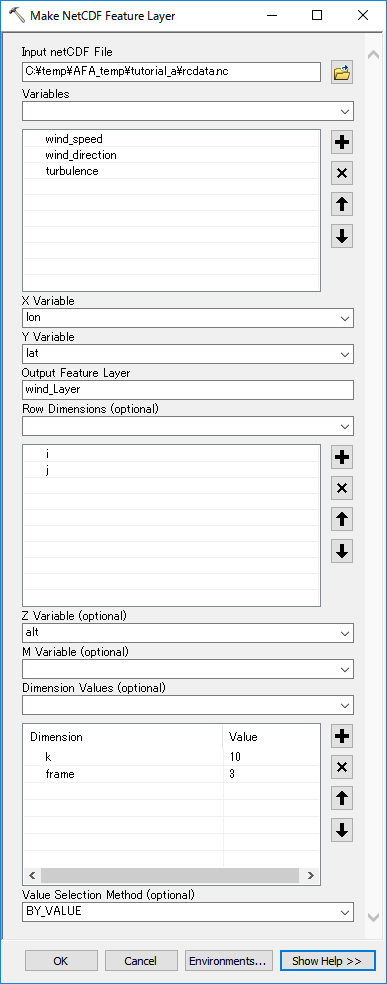
- [入力netCDFファイル]
- [Input netCDF File]
シミュレーションデータNetCDFファイルを指定します。
Set the simulation data netCDF file.
- [変数]
- [Variables]
ポイント・フィーチャーの属性値として入れておきたい変数を追加します。
Add variables you want to include as attribute values of the point feature.
時系列データと統計データ(avg_など)を混在させる場合は、時系列データの変数をリストの一番上に移動させてください。
統計データの変数が一番上にあると、[ディメンション値]でフレーム番号の指定ができなくなります。
When mixing time series data and statistical data (such as avg_), move the time series data variable to the top of the list.
If the variable of the statistical data is at the top, you cannot set the frame number with [Dimension values].
- [X座標の変数]
- [X Variable]
"lon"を指定します。
Set "lon".
- [Y座標の変数]
- [Y Variable]
"lat"を指定します。
Set "lat".
- [出力フィーチャーレイヤー]
- [Output Feature Layer]
作成するフィーチャーレイヤーに付ける名前を入力します。
Enter a name for the feature layer you are creating.
- [ロウ ディメンション]
- [Row Dimensions]
水平断面(K断面)を表示したい場合は、"i"と"j"を選択して追加します。
鉛直断面(I断面)を表示したい場合は、"j"と"k"を選択して追加します。
鉛直断面(J断面)を表示したい場合は、"i"と"k"を選択して追加します。
If you want to display the horizontal section (K section), add "i" and "j" to the list.
If you want to display the vertical section (I section), add "j" and "k".
If you want to display the vertical section (J section), add "i" and "k".
- [Z値の変数]
- [Z Variable]
格子点の高度を表す"alt"を指定します。
Set "alt".
- [M値の変数]
- [M Variable]
空欄のままにしておきます。
Keep blank.
- [ディメンション値]
- [Dimension Values]
水平断面(K断面)を表示したい場合は、"k"を選択して追加し、右欄の[値]で表示する層のインデックス値を選択します。
If you want to display the horizontal section (K section), add "k", and select a index value of the section in [Value].
鉛直断面を表示したい場合は、[ロウ ディメンション]で指定していない"i"もしくは"j"を選択して追加します。
If you want to display the vertical section, select "i" or "j" not selected in [Row Dimensions] and add it.
時系列データの場合は、"frame"も選択して追加し、フレームのインデックス値(フレーム番号 - 1)を指定しておきます。
(フレーム番号は1始まり、インデックス値は0始まりです)
In the case of time series data, also select "frame" and add it, and specify the frame index value (frame number - 1).
(The frame number starts at 1, and the index value starts at 0.)
- [値の選択方法]
- [Value Selection Method]
"BY_VALUE"のままにしておきます。
Keep "BY_VALUE".
- [OK]をクリックすると、格子点のポイント・フィーチャーレイヤーが生成され、マップや3Dシーンに表示されます。
- Click [OK]. A point feature layer of grid points is created and displayed on the map or the 3D scene.
Copyright (C) 2020 Environmental GIS Laboratory Co.,Ltd. All rights reserved.